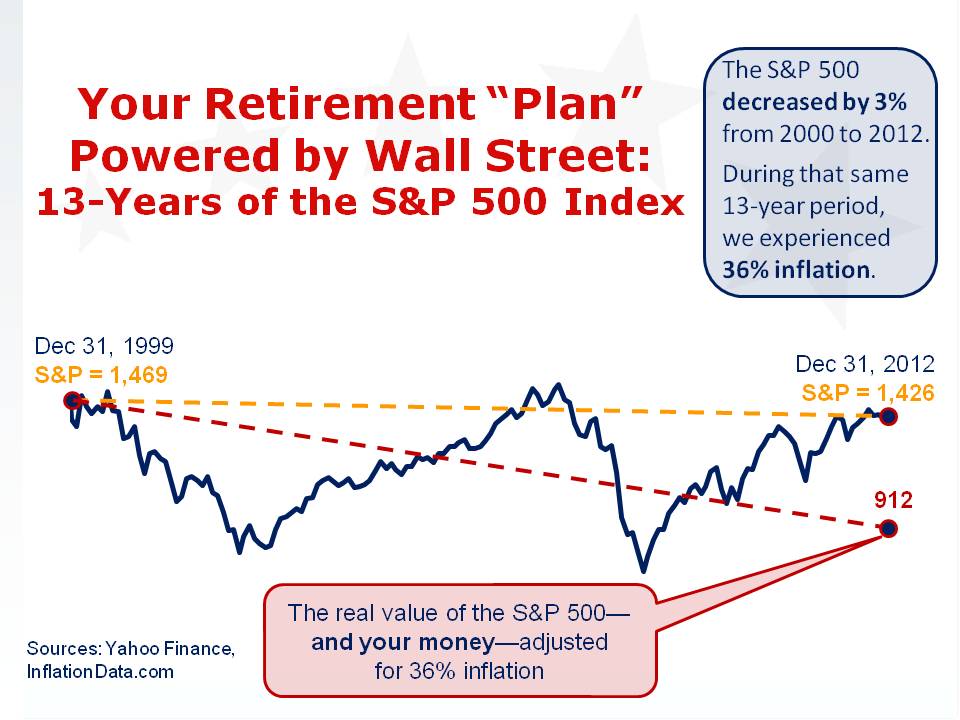
As the bull market that began in March, 2009 picks up steam, the Wall Street stock jocks are urging individual investors to jump back into the market with both feet. They boast that the S&P 500 has hit a 5-year high and is closing in on a new all-time high. But – somehow – they all forget to mention one pretty important fact: It also ended the year 3% lower than where it was 13 years ago at the end of 1999.
This chart tells the rest of the story you’re not hearing…

You’ll notice inflation was 36% over the past 13 years, which took an enormous bite out of the purchasing power of your savings.
Some readers may be wondering why I didn’t include the value of the dividends earned by the S&P 500 companies in the chart. So let’s do that now. The total return of the S&P 500 (including dividends) for the past 13 years was 22%, which is an average return of about 1.7% per year – and still lags inflation.
Don’t forget the fees and taxes…
[Read more…] “Stock market hits 5 year high – what they’re not telling you”
